

AI Analytics is in beta. The button on the dashboard is marked Beta. Everything else on Analytics is available to anyone who can sign in.
Open Analytics
Open Analytics in the sidebar. You start on Overview, the dashboard your organization shares.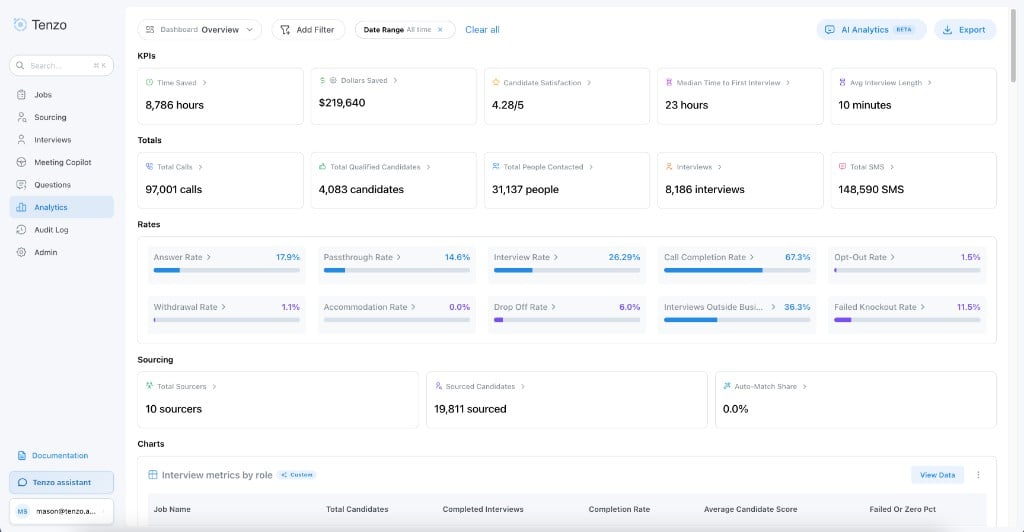
Analytics Overview
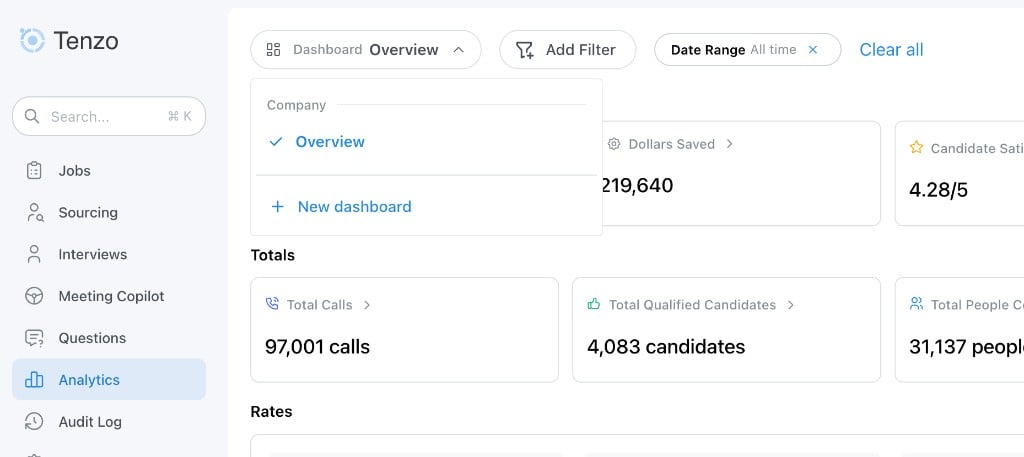
Dashboard menu
Whose jobs you see
You only see jobs you already have access to. That covers every number, chart, and download on the page. Sharing a dashboard with a teammate does not open jobs they cannot already see. If you cannot open any jobs, the page is empty. Folder / Job only offers jobs you can open. Test candidates are left out, along with candidates and jobs that have been removed. Filters focus the page on a smaller slice. Clear them to return to every job you can open.
Changing a filter updates the numbers. The charts stay where you arranged them.
Overview
Overview is grouped into KPIs, Totals, Rates, and Sourcing, with Charts below them. Submittals from Interviews and Hires appear when your organization has that information. Open View Data on a number to see the people behind it. You get a short preview, and you can download everyone who matches. The preview also says which date that number uses.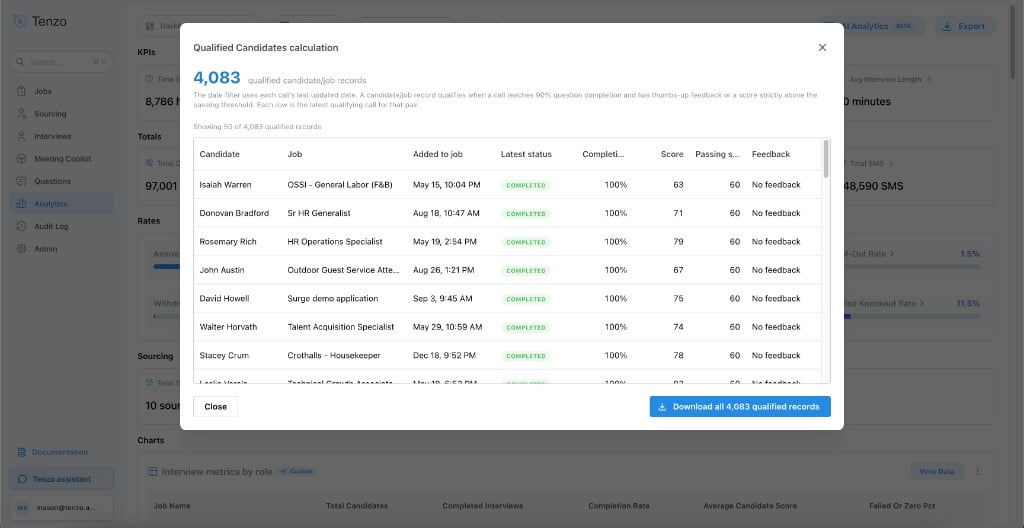
Qualified Candidates calculation
KPIs
Totals
Rates
Sourcing
Each person is counted once for each job they were sourced into, on the day they were added to that job.
Monthly Active Sourcers shows how many people sourced at least one candidate in each month. Auto-Match and candidates with no sourcer are left out. On All time, you see every month.
Team Sourcing Contribution shows how many candidates each recruiter sourced. Auto-Match has its own bar at the top. People are listed from most candidates to fewest. Candidates with no sourcer stay in Sourced Candidates and are omitted from this chart. Select a bar to open that person’s candidates.
When nothing was sourced, these numbers are zero. If the section cannot load, it says so.
Charts
Below the numbers, Charts includes:- Communication Metrics — outreach on one side (people contacted, calls, and texts) and results on the other (candidates, interviews, thumbs up, and thumbs down). Select a candidates, calls, texts, or interviews bar to open those people. Thumbs up and thumbs down stay on the chart.
- Passthrough Rate, Candidate Satisfaction, Time Saved Trend, and Dollars Saved Trend
- Withdrawal Reasons and Interviews by Language
- Monthly Active Sourcers and Team Sourcing Contribution
- A heatmap of completed interviews by the candidate’s local weekday and hour
Dollars saved
Dollars Saved starts from the hours saved, multiplies by an hourly rate, and then adds burden for extra cost such as benefits and overhead. The rate and burden are shared by everyone in your organization. A Global Admin, or anyone with Edit all jobs, can change them from Edit assumptions on the Dollars Saved number or chart. Set Hourly rate (USD) and Burden (%). Use zero or a positive number.Export
Export downloads a spreadsheet of the candidates on the jobs in your current view, most recently contacted first. You only get jobs you can already open. If outreach is still going while the file downloads, a few people can be added or dropped from the file.AI Analytics
AI Analytics lets you ask for a chart in everyday language. It uses the same filters, and the same jobs, as the rest of the page.- Select AI Analytics.
- Describe what you want to see. If you want a starting point, try one of the suggestions: weekly call volume by status, top jobs by completed calls, a breakdown of call status, or jobs by total call volume.
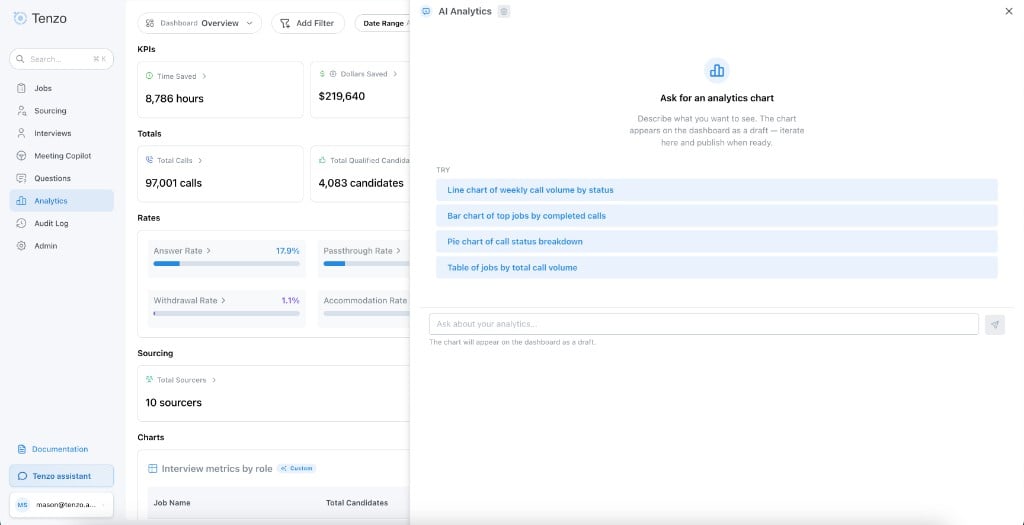
AI Analytics before a chart is created
- The chart lands on the dashboard as a draft, marked Custom and DRAFT, with Publish on the card. Only you can see it. Ask a follow-up, such as “break down by job”, and the draft updates in place.
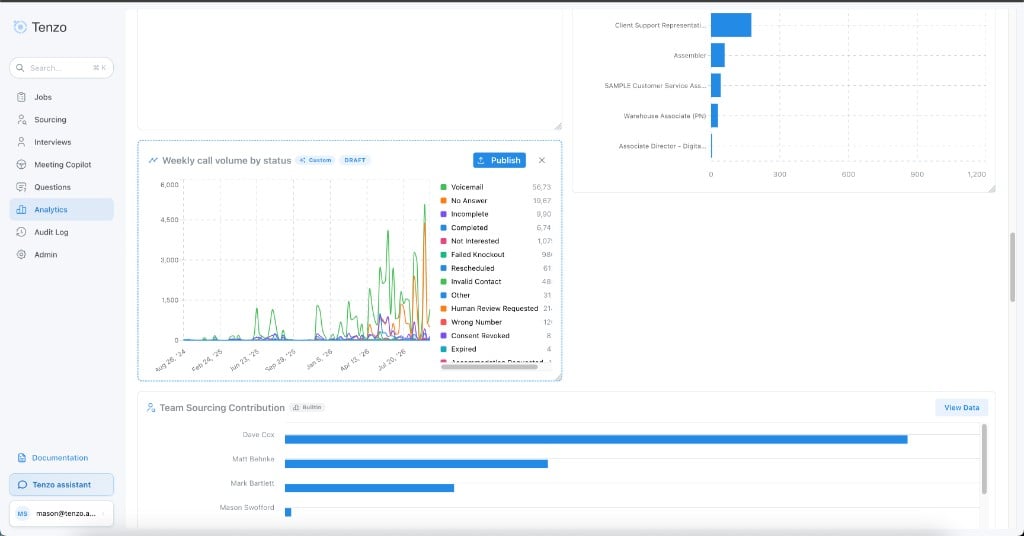
Draft chart on the dashboard
- Name it in Card title.
- Select Publish when you want the chart saved on this dashboard for the people who can see it. Publish appears when you are allowed to edit the dashboard and the draft is new or has changed.
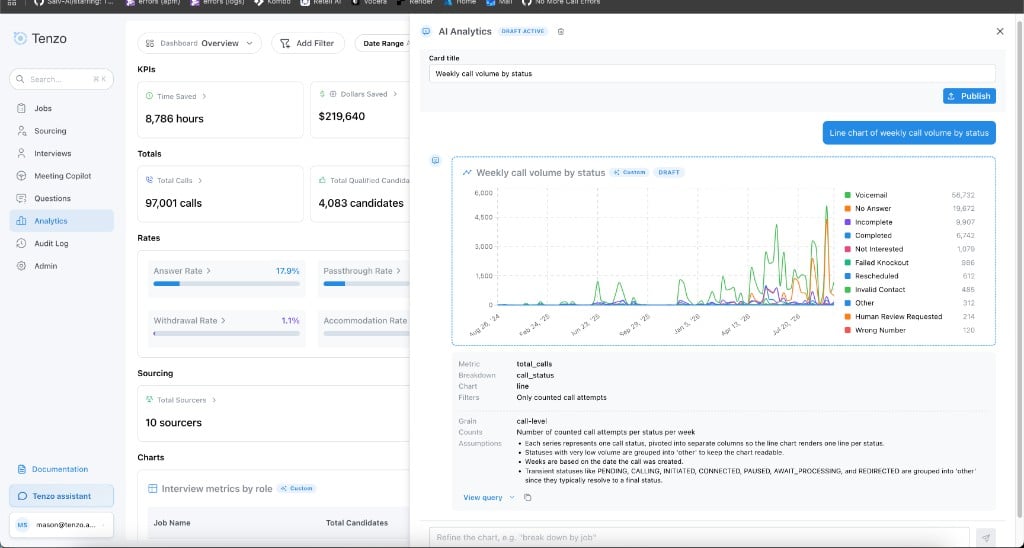
Draft chart in AI Analytics
Dashboards
Open Dashboard and select New dashboard. Give it a name, then choose who can see it:- Everyone in this organization — listed under Company. This is the choice a new dashboard starts with.
- Only me — listed under My dashboards.
- Specific people — also under My dashboards. Pick them under People with access. They can view the dashboard and its charts. You still rename it, delete it, change who can see it, add charts, and rearrange them.