> ## Documentation Index
> Fetch the complete documentation index at: https://f4c7a9e2d8b1-docs.tenzo.ai/llms.txt
> Use this file to discover all available pages before exploring further.
# Analytics
> See how your jobs are performing, and build your own charts with AI Analytics
**AI Analytics is in beta.** The button on the dashboard is marked **Beta**. Everything else on Analytics is available to anyone who can sign in.
## Open Analytics
Open **Analytics** in the sidebar. You start on **Overview**, the dashboard your organization shares.
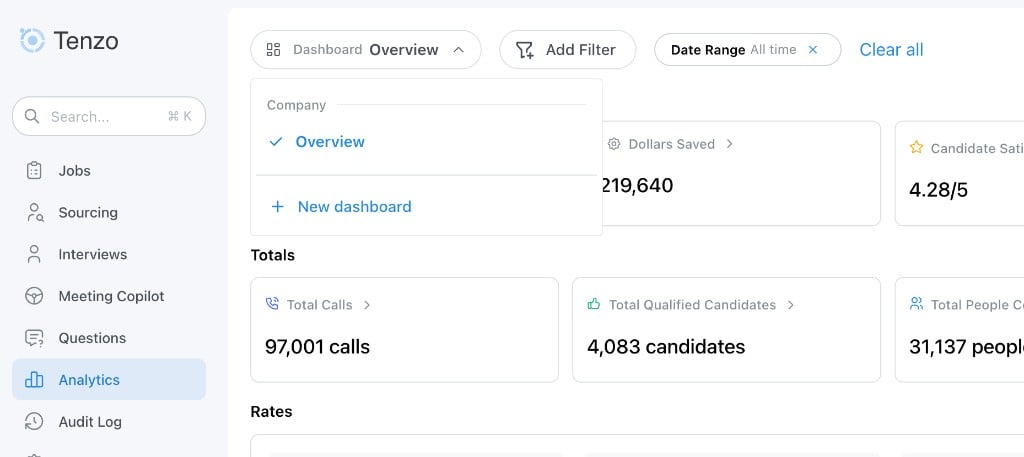
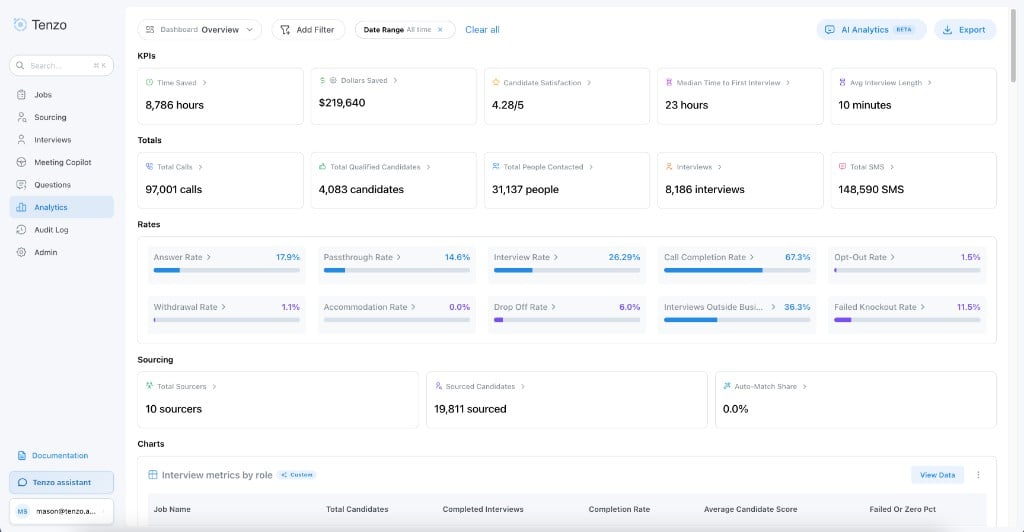 Use **Dashboard** at the top of the page to switch views. **Overview**, and any dashboard shared with the whole organization, is listed under **Company**. A dashboard that is only yours, or shared with a few people, is under **My dashboards**. **Add Filter** sits beside it.
 ## Whose jobs you see
You only see jobs you already have access to. That covers every number, chart, and download on the page. Sharing a dashboard with a teammate does not open jobs they cannot already see. If you cannot open any jobs, the page is empty. **Folder / Job** only offers jobs you can open.
Test candidates are left out, along with candidates and jobs that have been removed.
Filters focus the page on a smaller slice. Clear them to return to every job you can open.
| Filter | What it does |
| - | - |
| **Date Range** | Choose the dates you care about. **All time** includes everything. |
| **Folder / Job** | Limit the view to the folders or jobs you pick. |
| **Recruiter** | Limit the view to jobs for the recruiters you pick. |
| **Candidate Source** | Choose **Sourced** or **Applicants**. Leave both selected, or neither, to include everyone. |
| **Sourced By** | Limit the view to candidates sourced by the people you pick. |
Changing a filter updates the numbers. The charts stay where you arranged them.
## Overview
**Overview** is grouped into **KPIs**, **Totals**, **Rates**, and **Sourcing**, with **Charts** below them. **Submittals from Interviews** and **Hires** appear when your organization has that information.
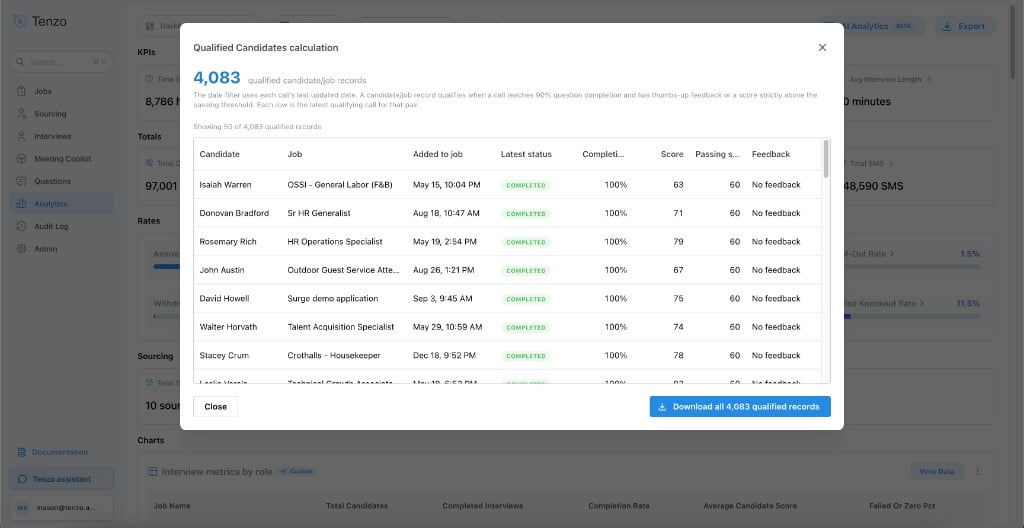
Open **View Data** on a number to see the people behind it. You get a short preview, and you can download everyone who matches. The preview also says which date that number uses.
## Whose jobs you see
You only see jobs you already have access to. That covers every number, chart, and download on the page. Sharing a dashboard with a teammate does not open jobs they cannot already see. If you cannot open any jobs, the page is empty. **Folder / Job** only offers jobs you can open.
Test candidates are left out, along with candidates and jobs that have been removed.
Filters focus the page on a smaller slice. Clear them to return to every job you can open.
| Filter | What it does |
| - | - |
| **Date Range** | Choose the dates you care about. **All time** includes everything. |
| **Folder / Job** | Limit the view to the folders or jobs you pick. |
| **Recruiter** | Limit the view to jobs for the recruiters you pick. |
| **Candidate Source** | Choose **Sourced** or **Applicants**. Leave both selected, or neither, to include everyone. |
| **Sourced By** | Limit the view to candidates sourced by the people you pick. |
Changing a filter updates the numbers. The charts stay where you arranged them.
## Overview
**Overview** is grouped into **KPIs**, **Totals**, **Rates**, and **Sourcing**, with **Charts** below them. **Submittals from Interviews** and **Hires** appear when your organization has that information.
Open **View Data** on a number to see the people behind it. You get a short preview, and you can download everyone who matches. The preview also says which date that number uses.
 ### KPIs
| Metric | What it shows |
| - | - |
| **Time Saved** | Time your team did not have to spend on candidate conversations, across the jobs in view. |
| **Dollars Saved** | That time, turned into dollars. See [Dollars saved](#dollars-saved). |
| **Candidate Satisfaction** | The average score candidates gave after the interview, from 1 to 5. Stars beside the number show how full that score is. |
| **Median Time to First Interview** | The typical time from first contact to the start of the first interview. |
| **Avg Interview Length** | How long completed interviews usually run. |
### Totals
| Metric | What it shows |
| - | - |
| **Total Calls** | How many times a candidate was called. |
| **Total Qualified Candidates** | Candidates with a thumbs up, or a score above the job's passing score. |
| **Total People Contacted** | People reached by phone, text, or email. Calling the same person again on the same job still counts as one person. |
| **Interviews** | Calls where the candidate answered at least one question. |
| **Total SMS** | Texts sent and received. |
| **Submittals from Interviews** | Submittals for candidates who finished an interview. Shown when your organization tracks submittals. |
| **Hires** | Hires recorded after a completed interview. Shown when your organization tracks hires. |
### Rates
| Metric | What it shows |
| - | - |
| **Answer Rate** | How often candidates picked up, including conversations that were rescheduled. |
| **Passthrough Rate** | Of the people contacted, how many qualified. |
| **Interview Rate** | Completed interviews compared with people contacted. |
| **Call Completion Rate** | Of the interviews that started, how many finished every question. |
| **Opt-Out Rate** | How often someone already in the process asked to stop the AI interview. |
| **Withdrawal Rate** | How often a contacted candidate withdrew. |
| **Accommodation Rate** | How often a contacted candidate asked for an accommodation. |
| **Drop Off Rate** | Interviews that started and then ran out of follow-ups before they were finished. Candidates who were not interested, and candidates who failed a knockout question, are left out. |
| **Interviews Outside Business Hours** | Completed interviews outside Monday–Friday, 9am–5pm in the candidate's own time zone. |
| **Failed Knockout Rate** | Interviews that started and then failed a required knockout question. Candidates who were not interested are left out. |
### Sourcing
Each person is counted once for each job they were sourced into, on the day they were added to that job.
| Metric | What it shows |
| - | - |
| **Total Sourcers** | Recruiters who sourced at least one candidate in the dates you picked. **Auto-Match** is kept separate from people. On **All time**, this covers every date. Someone who has left still counts, and is shown by email. |
| **Sourced Candidates** | Everyone sourced in that period, including candidates with no sourcer listed. |
| **Auto-Match Share** | The share of sourced candidates that **Auto-Match** added, out of candidates who have a sourcer listed. When nobody is listed, the share is 0%. |
**Monthly Active Sourcers** shows how many people sourced at least one candidate in each month. **Auto-Match** and candidates with no sourcer are left out. On **All time**, you see every month.
**Team Sourcing Contribution** shows how many candidates each recruiter sourced. **Auto-Match** has its own bar at the top. People are listed from most candidates to fewest. Candidates with no sourcer stay in **Sourced Candidates** and are omitted from this chart. Select a bar to open that person's candidates.
When nothing was sourced, these numbers are zero. If the section cannot load, it says so.
### Charts
Below the numbers, **Charts** includes:
* **Communication Metrics** — outreach on one side (people contacted, calls, and texts) and results on the other (candidates, interviews, thumbs up, and thumbs down). Select a candidates, calls, texts, or interviews bar to open those people. Thumbs up and thumbs down stay on the chart.
* **Passthrough Rate**, **Candidate Satisfaction**, **Time Saved Trend**, and **Dollars Saved Trend**
* **Withdrawal Reasons** and **Interviews by Language**
* **Monthly Active Sourcers** and **Team Sourcing Contribution**
* A heatmap of completed interviews by the candidate's local weekday and hour
**View Data** on a chart lists everyone who matches your current filters. It is the full filtered list, rather than only the bar or hour you clicked. **Team Sourcing Contribution** is the exception: selecting a bar opens that person's candidates.
If you can edit the dashboard, drag a chart to move it and drag a corner to resize it. The numbers above the charts stay in place.
## Dollars saved
**Dollars Saved** starts from the hours saved, multiplies by an hourly rate, and then adds burden for extra cost such as benefits and overhead.
The rate and burden are shared by everyone in your organization. A [Global Admin](/user-management/users#user-roles-and-access), or anyone with **Edit all jobs**, can change them from **Edit assumptions** on the **Dollars Saved** number or chart. Set **Hourly rate (USD)** and **Burden (%)**. Use zero or a positive number.
## Export
**Export** downloads a spreadsheet of the candidates on the jobs in your current view, most recently contacted first. You only get jobs you can already open. If outreach is still going while the file downloads, a few people can be added or dropped from the file.
## AI Analytics
**AI Analytics** lets you ask for a chart in everyday language. It uses the same filters, and the same jobs, as the rest of the page.
1. Select **AI Analytics**.
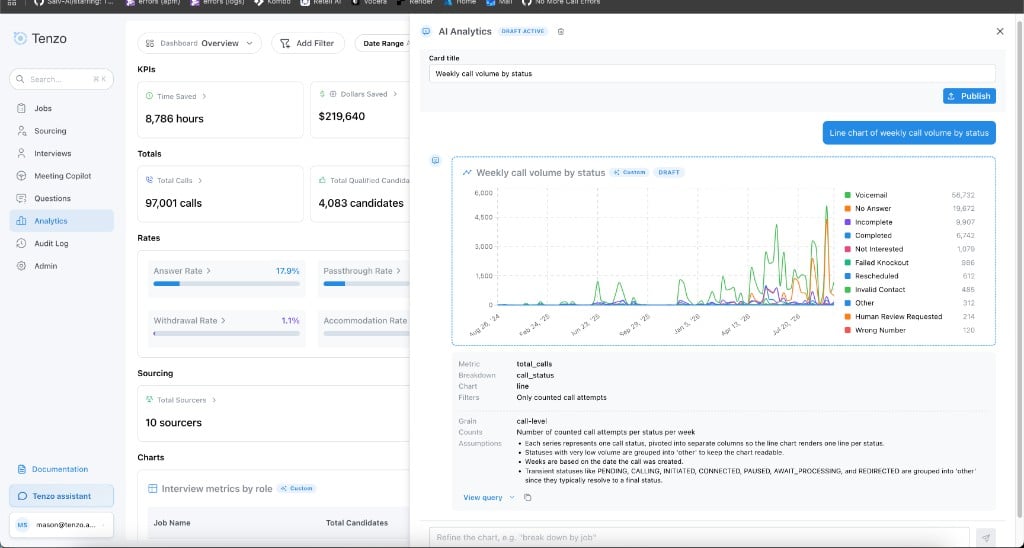
2. Describe what you want to see. If you want a starting point, try one of the suggestions: weekly call volume by status, top jobs by completed calls, a breakdown of call status, or jobs by total call volume.
### KPIs
| Metric | What it shows |
| - | - |
| **Time Saved** | Time your team did not have to spend on candidate conversations, across the jobs in view. |
| **Dollars Saved** | That time, turned into dollars. See [Dollars saved](#dollars-saved). |
| **Candidate Satisfaction** | The average score candidates gave after the interview, from 1 to 5. Stars beside the number show how full that score is. |
| **Median Time to First Interview** | The typical time from first contact to the start of the first interview. |
| **Avg Interview Length** | How long completed interviews usually run. |
### Totals
| Metric | What it shows |
| - | - |
| **Total Calls** | How many times a candidate was called. |
| **Total Qualified Candidates** | Candidates with a thumbs up, or a score above the job's passing score. |
| **Total People Contacted** | People reached by phone, text, or email. Calling the same person again on the same job still counts as one person. |
| **Interviews** | Calls where the candidate answered at least one question. |
| **Total SMS** | Texts sent and received. |
| **Submittals from Interviews** | Submittals for candidates who finished an interview. Shown when your organization tracks submittals. |
| **Hires** | Hires recorded after a completed interview. Shown when your organization tracks hires. |
### Rates
| Metric | What it shows |
| - | - |
| **Answer Rate** | How often candidates picked up, including conversations that were rescheduled. |
| **Passthrough Rate** | Of the people contacted, how many qualified. |
| **Interview Rate** | Completed interviews compared with people contacted. |
| **Call Completion Rate** | Of the interviews that started, how many finished every question. |
| **Opt-Out Rate** | How often someone already in the process asked to stop the AI interview. |
| **Withdrawal Rate** | How often a contacted candidate withdrew. |
| **Accommodation Rate** | How often a contacted candidate asked for an accommodation. |
| **Drop Off Rate** | Interviews that started and then ran out of follow-ups before they were finished. Candidates who were not interested, and candidates who failed a knockout question, are left out. |
| **Interviews Outside Business Hours** | Completed interviews outside Monday–Friday, 9am–5pm in the candidate's own time zone. |
| **Failed Knockout Rate** | Interviews that started and then failed a required knockout question. Candidates who were not interested are left out. |
### Sourcing
Each person is counted once for each job they were sourced into, on the day they were added to that job.
| Metric | What it shows |
| - | - |
| **Total Sourcers** | Recruiters who sourced at least one candidate in the dates you picked. **Auto-Match** is kept separate from people. On **All time**, this covers every date. Someone who has left still counts, and is shown by email. |
| **Sourced Candidates** | Everyone sourced in that period, including candidates with no sourcer listed. |
| **Auto-Match Share** | The share of sourced candidates that **Auto-Match** added, out of candidates who have a sourcer listed. When nobody is listed, the share is 0%. |
**Monthly Active Sourcers** shows how many people sourced at least one candidate in each month. **Auto-Match** and candidates with no sourcer are left out. On **All time**, you see every month.
**Team Sourcing Contribution** shows how many candidates each recruiter sourced. **Auto-Match** has its own bar at the top. People are listed from most candidates to fewest. Candidates with no sourcer stay in **Sourced Candidates** and are omitted from this chart. Select a bar to open that person's candidates.
When nothing was sourced, these numbers are zero. If the section cannot load, it says so.
### Charts
Below the numbers, **Charts** includes:
* **Communication Metrics** — outreach on one side (people contacted, calls, and texts) and results on the other (candidates, interviews, thumbs up, and thumbs down). Select a candidates, calls, texts, or interviews bar to open those people. Thumbs up and thumbs down stay on the chart.
* **Passthrough Rate**, **Candidate Satisfaction**, **Time Saved Trend**, and **Dollars Saved Trend**
* **Withdrawal Reasons** and **Interviews by Language**
* **Monthly Active Sourcers** and **Team Sourcing Contribution**
* A heatmap of completed interviews by the candidate's local weekday and hour
**View Data** on a chart lists everyone who matches your current filters. It is the full filtered list, rather than only the bar or hour you clicked. **Team Sourcing Contribution** is the exception: selecting a bar opens that person's candidates.
If you can edit the dashboard, drag a chart to move it and drag a corner to resize it. The numbers above the charts stay in place.
## Dollars saved
**Dollars Saved** starts from the hours saved, multiplies by an hourly rate, and then adds burden for extra cost such as benefits and overhead.
The rate and burden are shared by everyone in your organization. A [Global Admin](/user-management/users#user-roles-and-access), or anyone with **Edit all jobs**, can change them from **Edit assumptions** on the **Dollars Saved** number or chart. Set **Hourly rate (USD)** and **Burden (%)**. Use zero or a positive number.
## Export
**Export** downloads a spreadsheet of the candidates on the jobs in your current view, most recently contacted first. You only get jobs you can already open. If outreach is still going while the file downloads, a few people can be added or dropped from the file.
## AI Analytics
**AI Analytics** lets you ask for a chart in everyday language. It uses the same filters, and the same jobs, as the rest of the page.
1. Select **AI Analytics**.
2. Describe what you want to see. If you want a starting point, try one of the suggestions: weekly call volume by status, top jobs by completed calls, a breakdown of call status, or jobs by total call volume.
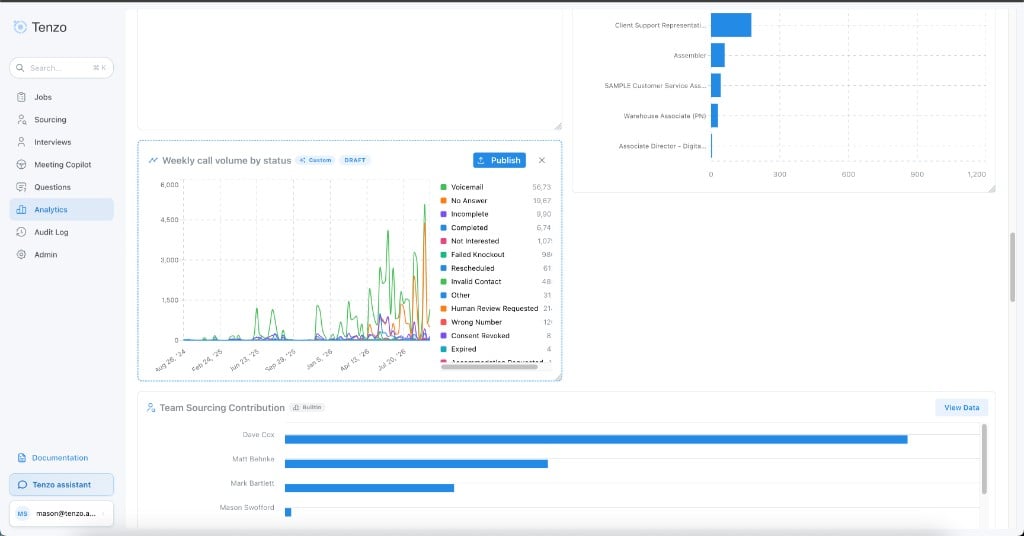
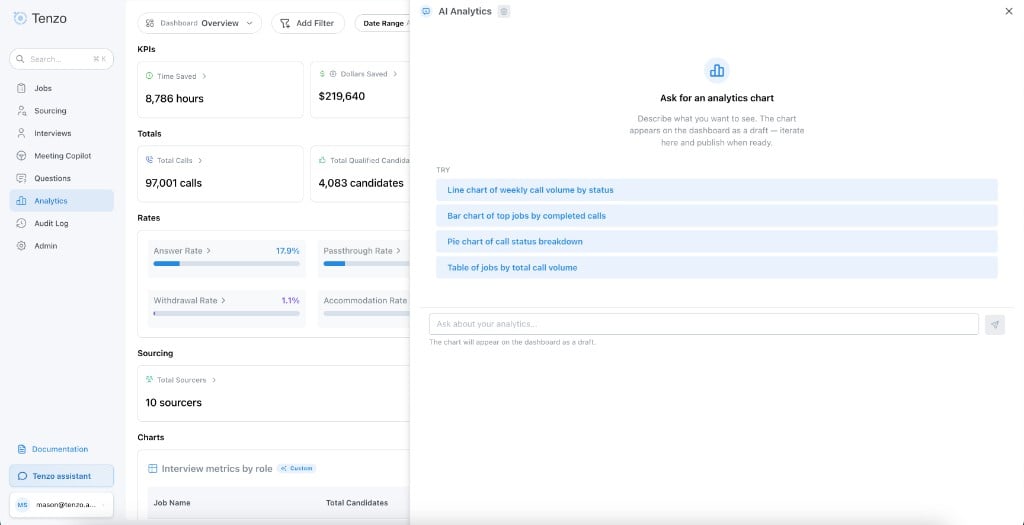 3. The chart lands on the dashboard as a draft, marked **Custom** and **DRAFT**, with **Publish** on the card. Only you can see it. Ask a follow-up, such as "break down by job", and the draft updates in place.
 4. Name it in **Card title**.
5. Select **Publish** when you want the chart saved on this dashboard for the people who can see it. **Publish** appears when you are allowed to edit the dashboard and the draft is new or has changed.
4. Name it in **Card title**.
5. Select **Publish** when you want the chart saved on this dashboard for the people who can see it. **Publish** appears when you are allowed to edit the dashboard and the draft is new or has changed.
 Your drafts are still on the dashboard the next time you open it, even before you open the chat. **Discard draft** throws the draft away. If the chart was already published, discarding brings that published version back.
If publishing does not go through, the saved chart stays as it was. Adjust what you asked for and try again. If the page is briefly unavailable, wait a moment and publish again.
You can ask for a single number, a line, a bar, a pie, a heatmap, or a table. If a line or bar chart would mix a count with a percentage, it is shown as a table so both stay easy to read.
Your filters apply here too, including sourcing. You can ask for a whole month, such as "since June". For part of a month, include the start and end dates in the question.
Open a published chart to see **How it's calculated** and its history. History shows earlier versions of the chart, filled in with the numbers from your current filters. If an older version can no longer be drawn, the history says so. You can also open the candidates behind a chart when the chart is about individual people. A chart that only counts something else, such as how many people sourced, has no candidate list.
On **Overview**, a single number, draft or published, sits in **Totals** at the same width as **Total Calls** and stays put. Its menu is the light blue button on the card. Any other chart sits with the charts already on the page. On a dashboard you create, you only see the charts you add, and you can rearrange a single number with them.
## Dashboards
Open **Dashboard** and select **New dashboard**. Give it a name, then choose who can see it:
* **Everyone in this organization** — listed under **Company**. This is the choice a new dashboard starts with.
* **Only me** — listed under **My dashboards**.
* **Specific people** — also under **My dashboards**. Pick them under **People with access**. They can view the dashboard and its charts. You still rename it, delete it, change who can see it, add charts, and rearrange them.
You own the dashboard, so you are not added to the viewer list.
The pencil renames a dashboard. On one you created, it also changes who can see it. Someone who can edit **Overview** can rename it, and **Overview** itself stays on the list. Delete any other dashboard you own from the same menu, or from **Edit Dashboard**. Deleting a dashboard cannot be undone.
Once you have more than five dashboards, you can search the list.
## Who can change what
Anyone who can open Analytics can ask for a chart and keep a private draft.
On **Overview**, saving a chart for everyone, and editing, deleting, or rearranging saved charts, is limited to [Global Admins](/user-management/users#user-roles-and-access) and people with **Edit all jobs**. Editors have that permission. Everyone else can view the saved charts, read a chart's history, and try their own drafts. **Overview** stays as it is until someone with permission publishes a change.
On a dashboard you created, you can publish and arrange charts even if you cannot edit every job in the organization. If the same chart is saved on more than one dashboard, only someone who can edit **Overview** can change or remove it.
You can keep chatting on a saved chart when you are allowed to change that chart.
This documentation is built and hosted on [Mintlify](https://mintlify.com), a developer documentation platform.
Your drafts are still on the dashboard the next time you open it, even before you open the chat. **Discard draft** throws the draft away. If the chart was already published, discarding brings that published version back.
If publishing does not go through, the saved chart stays as it was. Adjust what you asked for and try again. If the page is briefly unavailable, wait a moment and publish again.
You can ask for a single number, a line, a bar, a pie, a heatmap, or a table. If a line or bar chart would mix a count with a percentage, it is shown as a table so both stay easy to read.
Your filters apply here too, including sourcing. You can ask for a whole month, such as "since June". For part of a month, include the start and end dates in the question.
Open a published chart to see **How it's calculated** and its history. History shows earlier versions of the chart, filled in with the numbers from your current filters. If an older version can no longer be drawn, the history says so. You can also open the candidates behind a chart when the chart is about individual people. A chart that only counts something else, such as how many people sourced, has no candidate list.
On **Overview**, a single number, draft or published, sits in **Totals** at the same width as **Total Calls** and stays put. Its menu is the light blue button on the card. Any other chart sits with the charts already on the page. On a dashboard you create, you only see the charts you add, and you can rearrange a single number with them.
## Dashboards
Open **Dashboard** and select **New dashboard**. Give it a name, then choose who can see it:
* **Everyone in this organization** — listed under **Company**. This is the choice a new dashboard starts with.
* **Only me** — listed under **My dashboards**.
* **Specific people** — also under **My dashboards**. Pick them under **People with access**. They can view the dashboard and its charts. You still rename it, delete it, change who can see it, add charts, and rearrange them.
You own the dashboard, so you are not added to the viewer list.
The pencil renames a dashboard. On one you created, it also changes who can see it. Someone who can edit **Overview** can rename it, and **Overview** itself stays on the list. Delete any other dashboard you own from the same menu, or from **Edit Dashboard**. Deleting a dashboard cannot be undone.
Once you have more than five dashboards, you can search the list.
## Who can change what
Anyone who can open Analytics can ask for a chart and keep a private draft.
On **Overview**, saving a chart for everyone, and editing, deleting, or rearranging saved charts, is limited to [Global Admins](/user-management/users#user-roles-and-access) and people with **Edit all jobs**. Editors have that permission. Everyone else can view the saved charts, read a chart's history, and try their own drafts. **Overview** stays as it is until someone with permission publishes a change.
On a dashboard you created, you can publish and arrange charts even if you cannot edit every job in the organization. If the same chart is saved on more than one dashboard, only someone who can edit **Overview** can change or remove it.
You can keep chatting on a saved chart when you are allowed to change that chart.
This documentation is built and hosted on [Mintlify](https://mintlify.com), a developer documentation platform.